.webp)
Register in October and get 3 months of membership, absolutely free!
Henry Harvin® Learn to Communicate with Data with The Best Data Visualization Course by India Today
 featured Henry Harvin 4.8 / 5

Discover how to visualize your data using tableau by learning Data Visualization Course | Learn the fundamentals of data visualization & practice communicating with data | Explore, edit, fix, prepare and present data quickly and efficiently like a pro | Advance your career in analytics through our Tableau training and gain job-ready skills.
By submitting this form, you agree to receive SMS communications related to courses at Henry Harvin I have read and acknowledge Henry Harvin’s Privacy Policy and Terms & of Service Message & data rates apply. Message frequency varies. Reply HELP for help and STOP to opt-out.
Placed Learners


.webp)
.webp)
.webp)
.webp)
.webp)
.webp)
.webp)
.webp)
.webp)
.webp)
.webp)
.webp)


There's a reason that 95% of our alumni undertake 3+ courses as a minimum with Henry Harvin®
Data visualization is prompting a cultural shift toward more analytical, data-driven organizations by empowering users to explore their data.The course will teach you how to use Tableau to build data visualizations, organize data and design dashboards. Learn concepts such as statistics, data mapping, filters in tableau, calculations in tableau, dashboards, & more. Master Data Visualization using Tableau by understanding valuable methods for utilizing advanced calculations to solve complex problems.
It is a versatile 10-in-1 program that includes various aspects of competency development and career development.
Become a part of the Elite School of Data Science & Analytics of Henry Harvin® and join the 4,00,000+ large Alumni Network Worldwide.
Know the complete offerings of our Data Visualization Expert Course
.png)


.png)


.png)


Average salary hike
Access the best jobs in industry
Maximum salary hike

It is a trajectory that offers complete growth of an individual incorporating the two most significant focus areas of contemporary learning:The Competency Development and The Career Development .
Competency development is about building capabilities that not only meet current job demands but also anticipates the future needs. It includes:
1: Two-Way Live Training Two-way Live Online Interactive Classroom Sessions
.webp)
2: Projects Facility to undergo various projects along with the course.

3: Student Engagement & Events Free Access to #AskHenry Hackathons and Competitions & many other facilities from Henry Harvin®
.webp)
4: Masterclass Access to 52+ Masterclass Sessions for essential soft skill development

5: Membership Get Gold Membership of Henry Harvin®
.png)
6: E-Learning Access Free access to the E-learning Portal and future updates. Get access to PPTs, Projects, Quizzes, self-paced Video-based learning, a question bank, a library, practice tests, final assessment, a forum, and doubt sessions.
.webp)
Career Development lays focus on the essentials for acquiring a good career or diving into a highly competent one. It includes:
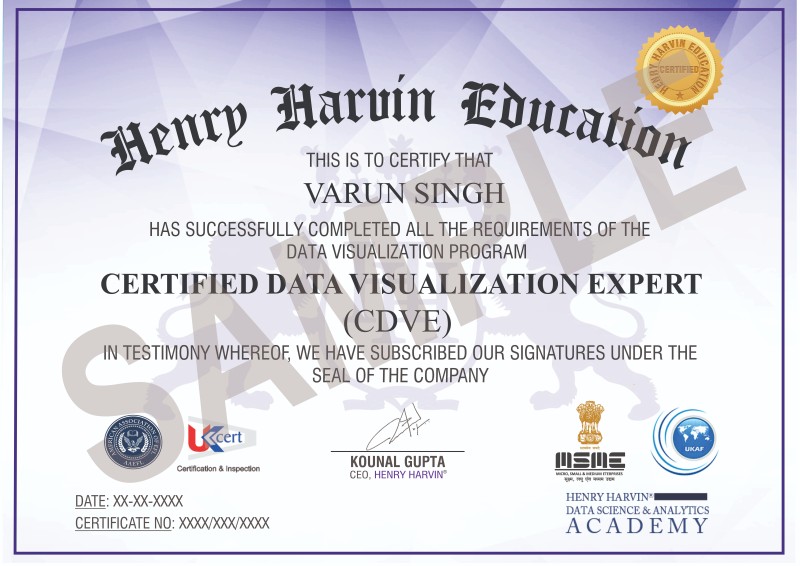
7: Hallmark Certification + License Distinguish your profile with global credentials and showcase expertise with our Hallmark Completion certificate with Professional License
.webp)
8: Internship Support Get Internship Support with Henry Harvin® and in top MNCs like J.P. Morgan, Accenture & many more via Forage & 100X Suite.

9: Entrepreneurship Mentorship Mentorship from Young Successful Entrepreneurs to set up a sustainable & scalable Business from scratch at both Freelance and entrepreneur levels
.webp)
10: Placement Support Get 3 in 1 Placement support through Placement Drives, Premium access to Job portal & Personalized Job Consulting
.webp)
 Module 1: Introduction to Data Visualization with Tableau
Module 1: Introduction to Data Visualization with Tableau
In this module, you will gain fundamental knowledge of Data Visualization, its history, benefits, introduction to Tableau, & more.
Module 2: Connecting to Various Data Sources and Preparing Data
In this module, you will learn the concepts of data blending, data interpreter, pivot, split, etc.
Module 3: Working with Metadata
In this module, learn about data types, dimension vs measures, default properties of fields, etc
Module 4: Spotlight One
In this module, understand the core concept of spotlight one.
Module 5: Filters in Tableau
In this module you will learn about different types of filters used in tableau such as date filter, visual filter, dimension filter, etc
Module 6: Structuring Data in Tableau
This module will teach you about how to structure data in tableau working with sort, group, sets, bins, etc
Module 7: Creating Charts & Graphs
In this module, learn topics such as highlight tables, line chart, bubble chart, word cloud, tree map, creating maps with tableau, etc
Module 8: Spotlight Two
In this module, understand the core concept of spotlight two.
Module 9: Calculations in Tableau
In module, learn different types of calculations, charts, LOD, & more
Module 10: Advanced Visual Analytics
In this module, learn about parameters, tooltips, charts selection, bands, clustering, & more.
Module 11: Dashboards & Stories
In this module learn about concepts of dashboard, actions in dashboards, creating & updating story points, etc
Module 12: Spotlight Three
In this module, understand the core concept of spotlight three.
Module 13: Complimentary Module 1: Soft Skills Development
Module 14: Complimentary Module 2: Resume Writing
Know the complete offerings of our Data Visualization Course
By submitting this form, you agree to receive SMS communications related to courses at Henry Harvin I have read and acknowledge Henry Harvin’s Privacy Policy and Terms & of Service Message & data rates apply. Message frequency varies. Reply HELP for help and STOP to opt-out.
Creating & Updating Story Points
Clustering Data
Working with Charts & Graphs
Table Calculations
Business Intelligence
Understanding Dashboards & Stories
.png)
Know more about 50+ tools covered in this Data Visualization Course
Projects
Projects
Projects
Projects
.png)
Projects

Projects

English, Hindi
Henry Harvin
6 years+ Exp

.webp)
Know more about the value of this certificate in the industry


We are dedicated to supporting our students throughout their career journey. Join us, and let's embark on a journey towards a successful and fulfilling career together.

Exclusive access to our dedicated job portal and apply for jobs. More than 2100+ hiring partners’ including top start–ups and product companies hiring our learners. Mentored support on job search and relevant jobs for your career growth.

Share what kind of job you are looking for and we will provide you with verified job openings that match your requirement.
Data Analyst
Business Intelligence Analyst
Data Visualization Specialist
Tableau Developer
Business Analyst
Data Scientist
Financial Analyst
Marketing Analyst
Data Architect
It takes at least four years to become a data visualization engineer. If you want to make data visualization your livelihood, you will need at least a bachelor's degree from a university. For some companies, applicants will sometimes also require a master's degree.
Data visualizations are not as easy to create as they look. There is a lot of work and effort that goes into it. There needs to be the right balance between all the visual elements. If you do too little or too much, your visualization will never create an impact.
Data visualization helps to tell stories by curating data into a form easier to understand, highlighting the trends and outliers. A good visualization tells a story, removing the noise from data and highlighting the useful information.
Because today, data visualization is becoming an absolute must-learn skill. As all organizations become increasingly data-driven, the ability to work with data isn't a bonus, it's essential.
Data visualization is a key component in being able to gain insight into your data. It helps make big and small data easier for humans to understand. It also makes it easier to detect patterns, trends, and outliers in groups of data.
Data visualization allows business users to gain insight into their vast amounts of data. It benefits them to recognize new patterns and errors in the data. Making sense of these patterns helps the users pay attention to areas that indicate red flags or progress.
Henry Harvin®️ ranks amongst the Top 500 Global Edtech Companies with 4,60,000+ Alumni, 900+ B2B Clients, 500+ Award Winning Trainers, and 1200+ Courses.
Trained
Gold Membership & Post Training Followups
Tailor Made Training
Flexible Schedule
Access to the Recorded Sessions
10 in 1 Program
Masterclasses By Henry Harvin®️
One-to-One Training


.webp)


.webp)

.webp)

.webp)

.webp)

.webp)

.webp)
.webp)


