


.webp)

.webp)

.webp)

.webp)

.webp)

.webp)

.webp)


 features Henry Harvin


★ ★ ★ ★ ★ 4.9 (5438 Ratings) 16532 Learners
Henry Harvin®️ ranks amongst the Top 500 Global EdTech Companies with 4,60,000+ Alumni, 900+ B2B Clients, 500+ Award Winning Trainers, and 1200+ Courses.
Placed Learners
Get 1-year Gold Membership of Henry Harvin® Analytics Academy and avail the following exclusive benefits:
The average salary of a Tableau Course Professional ranges between $108,697 to $158,000 per annum - Indeed.com. Thus, Business and Analytics Professionals looking for a steep hike in their salaries while being an expert in the current industry standards should take this course.
Preview
In this module the candidate will learn about Data Visualization, Comparison benefits against reading raw numbers, Real use cases from various business domains, Examples of using Tableau, installing Tableau, Tableau interface, Connecting to Data source, Tableau data types and Data preparation
What is data visualization?
Preview
In this module the candidate will learn about Architecture of Tableau, which includes learning of the installation, Desktop Architecture and Interface of Tableau, how to start with Tableau and the ways to share and export the work done in Tableau. The candidate will also be provided with a few Hands-on exercises, which will enhance the understanding of the Tableau
Topics:
Hands-on Exercise:
Preview
In this module the candidate will learn working with Metadata and Data Blending, which includes understanding Connection to Excel, Cubes and PDFs, Management of the Metadata, preparation of Data, Joins and Unions , and how to deal with NULL Values, Cross- database joining, data extraction etc. The candidate will also be provided with Hands-on Exercises which will enhance the understanding of the candidate, of the topic and its working
Topics:
Hands-on Exercise:
Preview
In this module the candidate will learn about Creation Sets, in which you will learn how to Mark, Highlight, Sort, Group, and use Sets, understand what are Constant Sets, Computed Sets, Bins etc. The candidate will also be provided with Hands-on Exercises which will enhance the knowledge of the topics learned
Topics:
Hands-on Exercise:
Preview
In this module the candidate will learn about Filters, how to work with Filters, Filtering Continuous Dates, Dimensions and Measures, create folders in Tableau, sorting in Tableau, Filtering in Tableau and the order of Operations, types of Sorting and Filters. The candidate will also be provided with Hands-on Exercises which will enhance the knowledge of the topics learned
Topics:
Hands-on Exercise:
Preview
In this module the candidate will learn about Visual Analytics and Organizing Data, in which the candidate will learn about usage of Formatting Pane and how to Format Data using Labels and Tooltips, Edit Axes and annotations, K-means cluster analysis, Trend and Reference lines, Visual Analytics and Forecasting, Confidence Interval, Reference lines and Bands. The candidate will also be provided with Hands-on Exercises which will enhance the knowledge of the topics learned and its working
Topics:
Hands-on Exercise:
Preview
In this module the candidate will learn about Mapping Preview, which includes Working on Coordinate points and the background image, Plotting Longitude and Latitude, editing unrecognized Location, Customizing Geocoding, Maps etc., Map visualization, Custom territories, Map box WMS map and creating Map projects in Tableau and Dual Axes Maps. The candidate will also be provided with Hands-on Exercises which will enhance the knowledge of the topics learned and its working
Topics:
Hands-on Exercise:
Preview
In this module the candidate will learn about Calculations and functions in Tableau, LOD expressions, aggregation and Replication with LOD expressions, Nested LOD expressions, Levels of details, Quick table calculations, Creation of calculated fields and Predefined calculations and validation
Preview
In this module the candidate will learn about Parameters, creating and its calculations, using Parameters with calculations Column and chart selection parameters, usage of Parameters in filter sessions, calculated fields and in reference line. The candidate will also be provided with Hands-on Exercises which will enhance the knowledge of the topics learned and its working
Topics:
Hands-on Exercise:
Preview
In this topic the candidate will learn about Charts and Graphs, such as, Dual axes graphs, Histograms, Single and dual axes, Box plot, Charts; motion, pie , bar etc., Maps: tree and heat maps, Market Based Analysis and text and highlighted table. The candidate will also be provided with Hands-on Exercises which will enhance the knowledge of the topics learned and its working
Topics:
Hands-on Exercise:
Preview
In this module the candidate will learn about Dashboard, which includes topics such as, building and formatting, best practices for making creative dashboard, creating stories, updating the story points, Adding annotations with descriptions, Highlight actions, URL actions, types of Joins, Tableau field types, Saving as well as publishing data source, difference between Live and Extract connection and various file types. The candidate will also be provided with Hands-on Exercises which will enhance the knowledge of the topics learned and its working.
11.1 Building and formatting a dashboard using size, objects, views, filters, and legends
11.2 Best practices for making creative as well as interactive dashboards using the actions
11.3 Creating stories, including the intro of story points
11.4 Creating as well as updating the story points
11.5 Adding catchy visuals in stories
11.6 Adding annotations with descriptions; dashboards and stories
11.7 What is a dashboard?
11.8 Highlight actions, URL actions, and filter actions
11.9 Selecting and clearing values
11.10 Best practices to create dashboards
11.11 Dashboard examples; using Tableau workspace and Tableau interface
11.12 Learning about Tableau joins
11.13 Types of joins
11.14 Tableau field types
11.15 Saving as well as publishing data source
11.16 Live vs extract connection
11.17 Various file types
Hands-on Exercise
1. Create a Tableau dashboard view, include legends, objects, and filters
2. Make the dashboard interactive
3. Use visual effects, annotations, and descriptions to create and edit a story
Preview
In this module the candidate will learn about Tableau prep, how Tableau prep helps combine join, sharp, and clean data for analysis, creation of smart examples with Tableau prep, and how data preparation is made simple and accessible, integrating Tableau prep with Tableau analytical workflow and a clear understanding the seamless process from data preparation to analysis with Tableau prep.
Preview
In this module the candidate will learn about Tableau with R and Hadoop, which includes Application and use cases of R, Deploying R on the Tableau platform, R functions in Tableau and The integration of Tableau with Hadoop. The candidate will also be provided with Hands-on Exercises which will enhance the knowledge of the topics learned and its working
Topics:
Hands-on Exercise:
Preview
Soft Skills Training
Preview
Resume Writing
Preview
- HR: Analyze the Attrition rate of Employees
- Sales: Predicting Department wise Sales
- Multi-Domain: Business Analytics Optimization
- Marketing: Website Trend Analysis
- Financial Analysis: Stock Market Prediction
- Finance: Analyze ETF Trends
Make registration for the Tableau Training and Certification Course.
Attend classes of Tableau Training Course to get 32 hours credits to be eligible for the certification. View session recordings in case missed.
Deliver the assignments and activities assigned during the Tableau Training Classes as part of the practical assessment system to become eligible for Data Visualization Certification.
Post-completion of the Tableau training course, get CDVS Certification from Govt. Recognized Institute. Post it on social media, get framed, and increase value in the industry.
Tableau is a powerful and fastest growing data visualization tool used in the Business Intelligence Industry that assists in simplifying raw data into an easily understandable format. It is the most powerful, secure and flexible end-to-end analytics platform that works advantageously from connection to collaboration.
The biggest draw towards Tableau is that Data analysis is accomplished very fast and the visualizations created are in the form of dashboards and worksheets, easily understood by all.
Going by your convenience enroll for on-campus Tableau Course or learn Tableau Online from the most acclaimed institute- Henry Harvin and see your career grow. Earning the certification of 'Certified Data Visualization Specialist' (CDVS) will be most rewarding as Henry Harvin’s name will authenticate your capabilities as a specialist.
By gaining mastery in Data Visualization using Tableau you will become adept in creating powerful Storyline Presentation, developing intrinsic understanding of how Table Calculations work and easily implementing Advanced Mapping Techniques. Armed with all these skill sets you will become eligible for thousands of untapped high-paying jobs in this field.
Today the demand to learn Tableau and to be able to work on the concepts of data visualization with a firm understanding of the Tableau architecture, is great among all professionals. The added benefit is that it doesn't require any specific qualification or any kind of programming skills to operate, allowing even a non-technical user to create a customized dashboard.
Henry Harvin, a decade old career and competency development organization, today is a leader in training and skill development with a focus on value creation. In continuation with their effort of providing skill-centric training through various courses, it has introduced Tableau Training Course- a 100% practical training.
As all organizations, companies and businesses, whether big or small, need professionals who are well trained in Tableau and Data Visualization, thus, creating a high demand for such professionals. Looking at new job opportunities or eager to acquire new skill sets, individuals from all industries lined up for Tableau Training.
The high demand of the course prompted Henry Harvin to introduce Tableau Training Online Course, benefitting thousands of candidates from far and wide. Touching on all crucial features of Tableau this course empowers the learners to explore, experiment with, fix, prepare, and present data smoothly, swiftly, and beautifully.
With time they have also added many more destinations for classroom training too, benefitting thousands of candidates with their exclusive Data Visualization Specialist Certification.
The duration of the course consists of thirty-two hours of live sessions and fifty hours of E-learning access.
The institute provides CDVS certifications to the students after completing the course.
After receiving the certification, students get job opportunities from top companies.
Yes, the live sessions include different projects that help the student know the concept well.
This course is mainly designed for professionals who want to increase their salary. Data Scientists, Business Intelligence, Statistical, Analysts, and other professionals included.
Companies seek individuals who have completed the Tableau Course in Pune. On various job boards, they can find a variety of opportunities. Henry Harvin helps students find employment.
Many Pune residents take Tableau classes as a side hustle. By building your portfolio, you can do freelance work. Enroll in the course to obtain the required certifications.
The Tableau course includes practical applications such as Introduction to data visualization,working with parameters,charts and many other concepts needed by analysts.
Yes, there are numerous institutes in Pune that offer online Tableau classes.
The course duration is thirty two hours of live training sessions.
Yes, Henry Harvin institute provides self-paced videos where students can learn the course in their free time.
Online live training sessions are available for Tableau courses in Bangalore.
No,while learning the Tableau course you don’t need the knowledge of SQL.But while creating a dashboard in Tableau students may need the knowledge of SQL for using data.
Yes institutes provide the course completion course in order to get job opporutnity.
Yes institute provides various placement opportunities to the students for Tableau course in Bangalore.
The Tableau Certification Training Course provides an in-depth understanding of Tableau Prep Builder, Tableau Desktop, Charts, LOD expressions, Tableau Online, etc. This Tableau training will assist you in mastering Business Intelligence, Data Visualization, and reporting tools. You will work with real-world cases from the Retail, Entertainment, Transportation, and Life Sciences industries throughout this online instructor-led training from Henry Harvin’s Tableau course. This Tableau course will help you pass the Tableau Desktop, Analyst, and Server certification exams.
Skills covered in the Tableau course are:
Data comprehension, Tableau Statistics, Analytical and Visualization, Effective Storytelling, Analyzing Data for Decision Making, Arithmetic logical LOD calculations
Globally, the Business Intelligence market is expanding rapidly, and this strong growth pattern, coupled with market demand, represents an excellent opportunity for the following IT professionals.
Business Analysts
Data Analysts
Project Managers
Data Scientists
Statisticians and Analysts
Business Intelligence Managers
Tableau is becoming one of the hottest trends in the market for Business Intelligence. Tableau experts are in high demand as the Data Visualization tool has been gaining popularity in various businesses, causing an increase in demand. Henry Harvin offers the best online tableau training in Mumbai, with more than 10,000 satisfied students.
There are no prerequisites for this Tableau training course online. However, prior knowledge of the R programming language and fundamental Data analytics and SQL concepts will be advantageous. To refresh your skills, Henry Harvin’s LMS will provide the following self-paced modules as prerequisites.
Average Time Required to Master Tableau:
Experts estimate that it takes the average person between two and six months to grasp this data visualization tool.
Excel and Tableau allow users to create basic, aesthetically pleasing charts and graphs, but Tableau simplifies the process. By dragging and dropping fields, Tableau can generate sophisticated charts. Once you create a chart or graph, you can convert it to a different visualization with a single click.
Indeed reports that the average annual salary for Tableau Developers is approximately 763,770. According to Glassdoor, the Tableau Developer salary in India ranges from 386,614 p.a. to 1,003,220 p.a. The starting Tableau salary in India is about 408,847 per year.
Yes, Tableau is a technical and data-related skill that enables you to analyze and present large amounts of data in multiple formats for improved decision-making.
The industry has a high demand for visualization specialists; therefore, now is the best time to learn this tool and obtain the highest/most rewarding employment opportunity as a Tableau developer in India. Tableau Consultant is one example of a possible career path. Business Intelligence Manager and Developer.
In India, Tableau Developer salaries range from 3.5 Lakhs to 9.6 Lakhs annually, with an average salary of 5.8 Lakhs.
You dont require programming languages, coding, technical expertise, or tool-use fundamentals to learn tableau in Henry Harvin.
You must have an active Desktop Certified Associate certification to take this exam. This examination tests candidates' knowledge of visual best practices, storytelling, and advanced technical abilities such as detailed calculations, connecting multiple data sources, and reorganization.
The national average Tableau Developer salary is 6,42,500.
As a beginner, you must first understand the fundamentals of SQL, which will be extremely helpful. Then, you can enroll in Henry Harvin’s Tableau course and adhere to its curriculum. And voila, you've mastered Tableau in one month! You will get video and expert guidance to accelerate your learning of Tableau.
According to a report by Indeed, the average salary for experienced developers is 20 lakhs per annum, while the average salary for new graduates is 8,55015. There is ample opportunity and growth if you learn Tableau from Henry Harvin.
You don't need to know SQL to learn or work with Tableau, but you should be fluent in it if you want to land a job using Tableau. Moreover, on a project, you will be required to create a Tableau dashboard using data.
To accelerate your learning of Tableau, you should study data types and structures and be proficient with spreadsheet applications such as Microsoft Excel.
You must configure a connection between Tableau and a TabPy server to include Python scripts in your flow. With a pandas data frame and some Python code, you can then use the available functions on the data in your flow.
Walmart, a United States-based retail organization with 2300000 employees and $572.80 billion in annual revenue; Amazon.com, a United States-based retail organization with 1541000 employees and $513.98 billion in annual revenue, and CVS Health Corporation, a United States-based.
Consider storing your data on a database server, such as Oracle, MySQL, or Microsoft SQL Server, if you have a large amount. Tableau Professional can connect to these larger database servers.
Tableau has its proprietary language, VisQL, similar to SQL, but C++ is used for most of the desktop code.
Tableau supports Public Citrix environments, Microsoft Hyper-V, Parallels, VMware, Microsoft Azure, and Amazon EC2. All Tableau products are compatible with virtualized environments when configured with the appropriate Windows operating system and minimum hardware specifications. CPUs must support SSE4. In Henry Harvin, we give training on these softwares to make you proficient.
Tableau transforms data from a never-ending challenge to a critical business asset by combining the data HR teams require, providing stakeholders with secure access to trusted sources of truth, and revealing insights through intuitive, powerful analytics.
You can save Work using a variety of Tableau-specific file types, including workbooks, bookmarks, packaged data files, data extracts, and data connection files.
Guidelines for Learning Tableau
Examine online Tableau graphs and data visualizations.
Adhere to the Tableau community
Enroll in Henry Harvin’s Tableau course
Identify and Align Competencies
Practice
Find free datasets
Create a Tableau portfolio
Create an online Tableau project footprint
Certified Tableau professionals have an advantage over their peers in terms of being hired by top MNCs for various positions, including Visual Analyst, Data Scientist, Business Analyst, Certified Tableau Analyst, and others, and receiving higher salaries.
Tableau's data visualization platform is one of the most popular tools on the market, and certification in Tableau can lead to high-paying jobs and career advancement. Tableau offers a variety of certifications for professionals seeking credentials as experts in this software. Henry Harvin has partnered with 600 companies to provide placement support.
Power BI is typically sluggish when handling large amounts of data. Tableau can efficiently manage large volumes of data. It is faster and provides extensive data visualization features. Tableau does not restrict the number of data points in visualization or impose row or size restrictions, providing you with a comprehensive view of your data.
Tableau is a visual analytics and reporting system that works directly with the programming languages R, Python, and others.
Tableau Public is a free online platform for exploring, creating, and sharing data visualizations.
Currently, Tableau offers three levels of certification: Tableau Specialist. Certified Associate in Tableau. Certified Tableau Professional.
Exams are difficult if you dont adequately prepared. To succeed, you must complete the tableau course training from Henry Harvin and the learning Paths outlined in the Exam Prep Guide.
Many Tableau users view data preparation as the most challenging aspect of Tableau. This procedure entails gathering, combining, structuring, cleansing, and transforming unprocessed data to be processed and analyzed.
The Tableau Training Course offered by Henry Harvin is intended to help you become a successful Tableau Professional.
Understand how data can be transformed through cleaning, splitting, pivoting, and merging techniques.
Learn how to connect with data and perform various data preparation steps to visualize it.
Using Tableau's built-in features, you can discover novel approaches to data analysis.
Create dynamic, personalized visualizations using parameters.
Create interactive dashboards by implementing actions.
Explore dashboard design best practices.
Gain extensive hands-on experience with Tableau's various techniques.
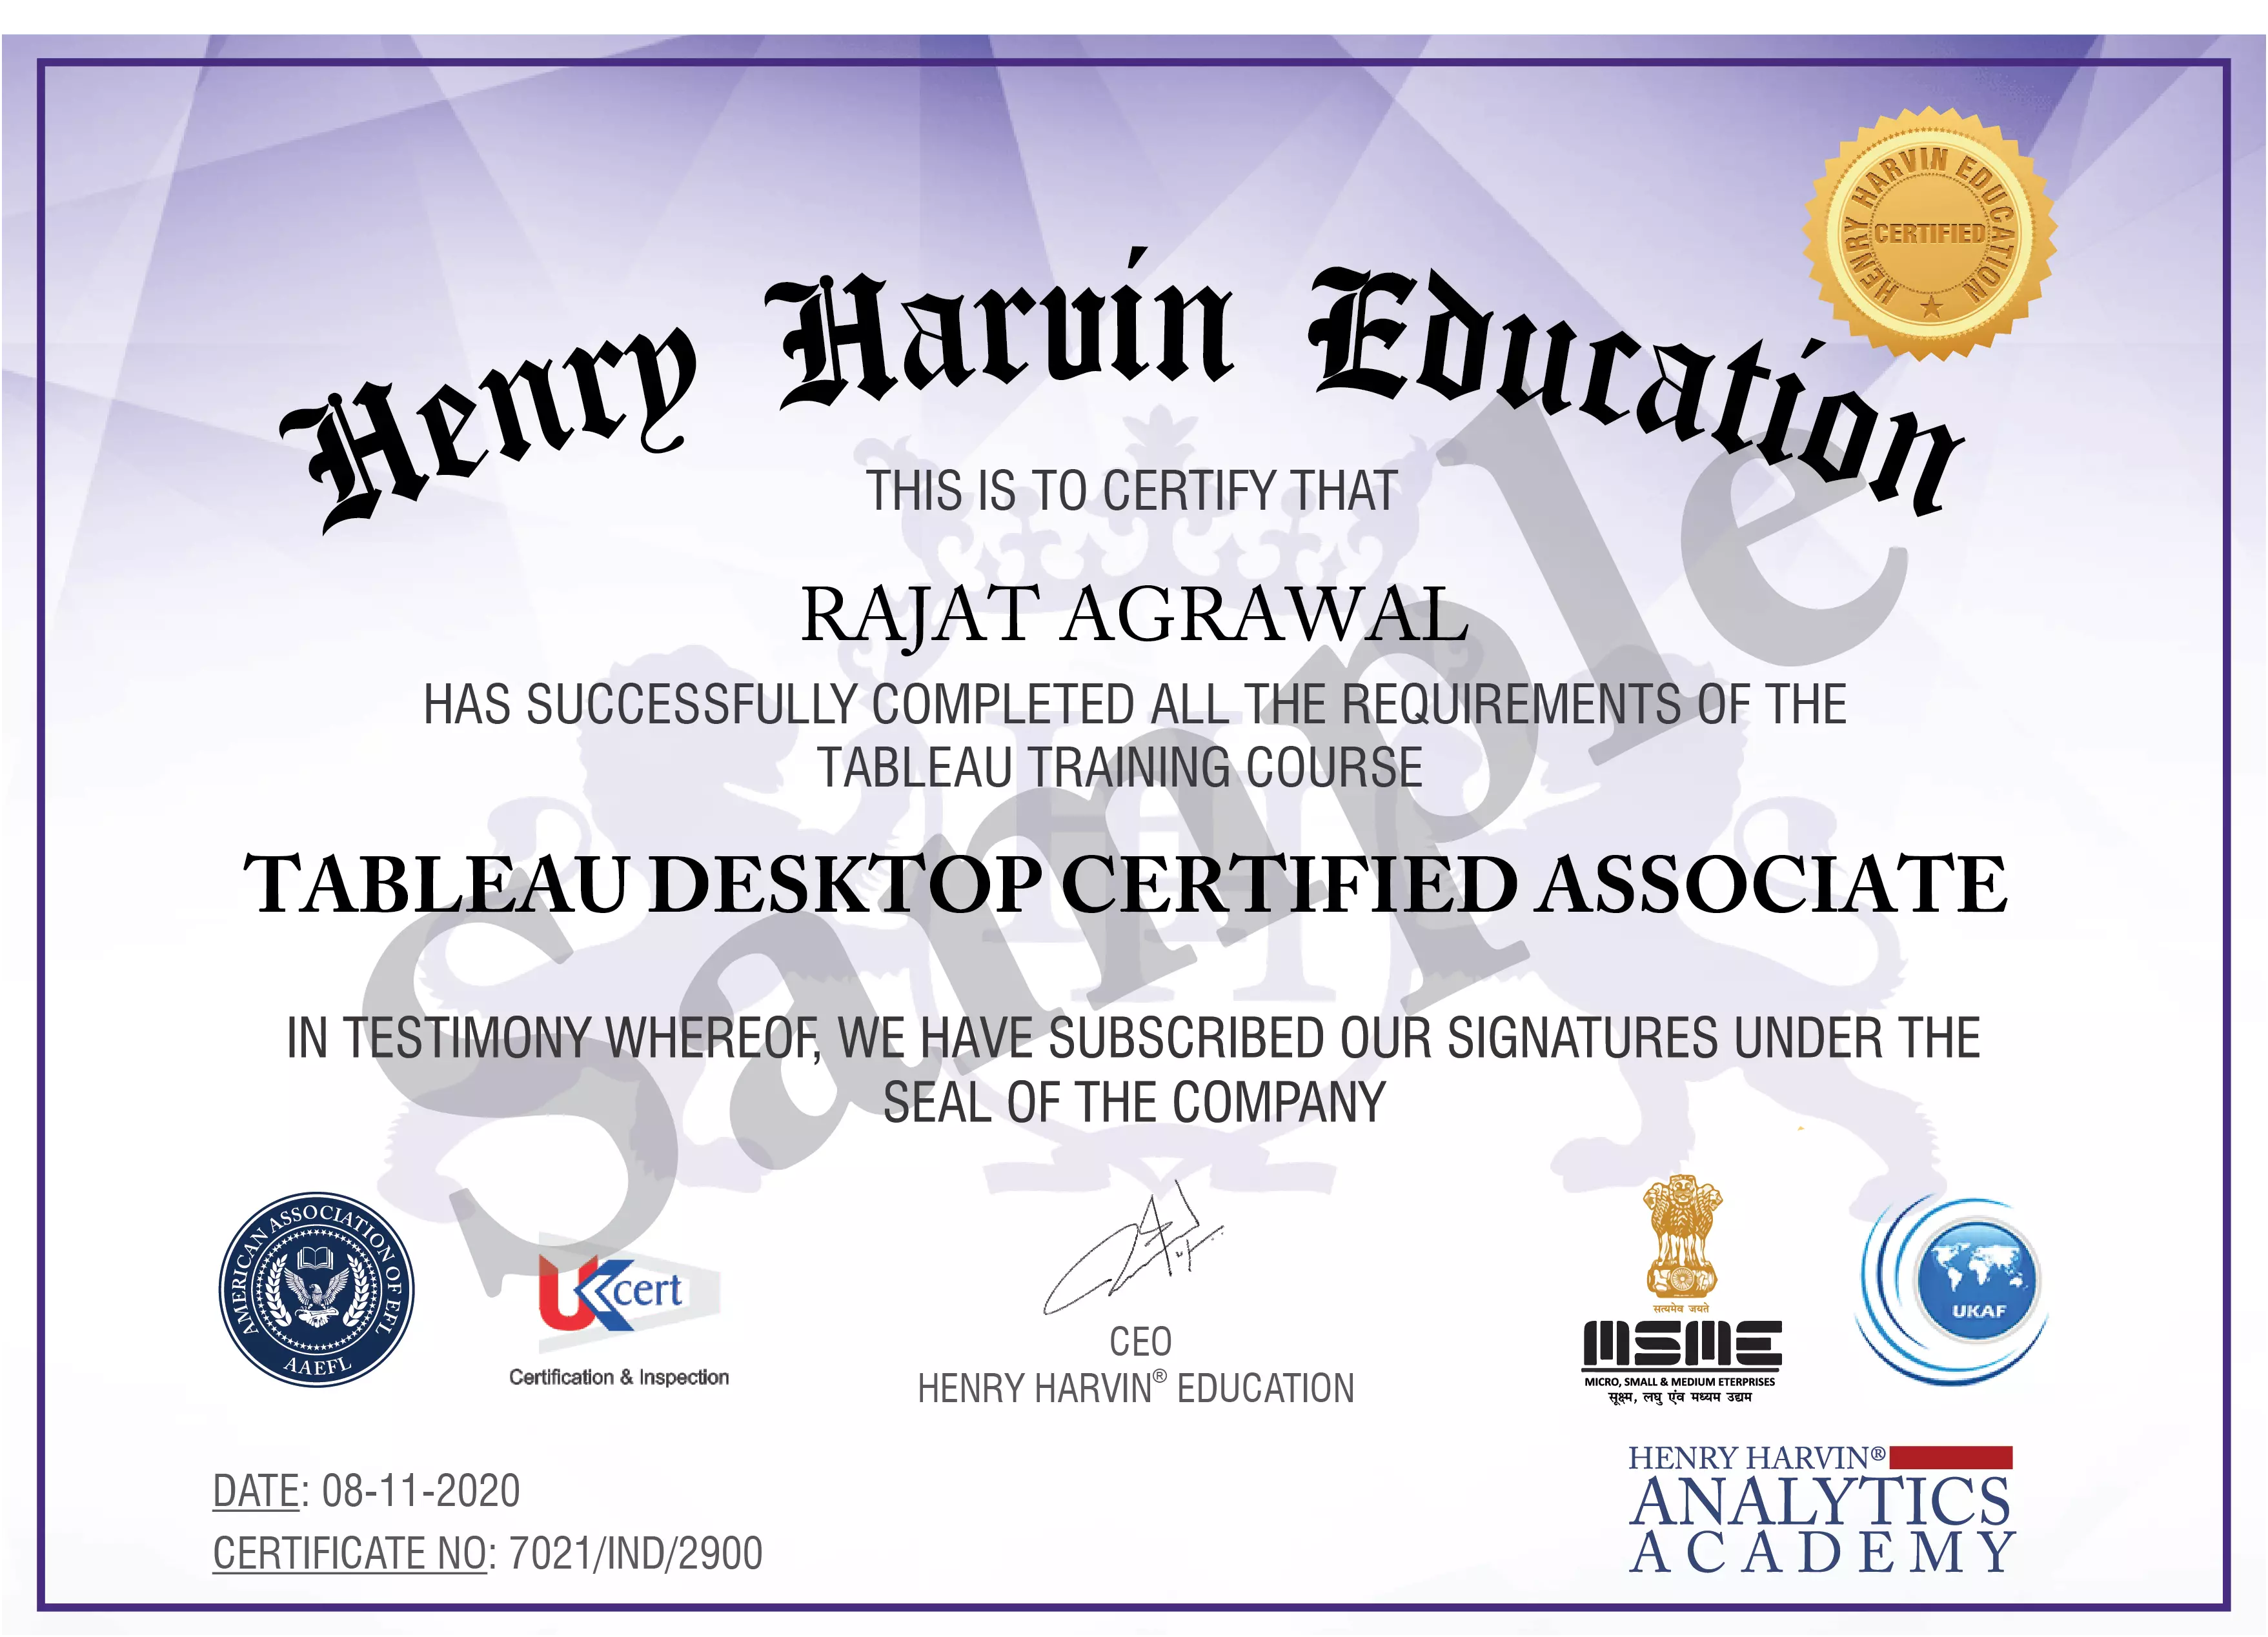
Henry Harvin provides a Tableau course completion certificate valid for a lifetime upon completing the course.
Henry Harvin’s Certified Data Visualization Specialist (CDVS) Course Certification.
Tableau Desktop Qualified Associate Certification.
Certificate of expertise in the most recent Tableau software and tools, including Tableau Desktop, Tableau Prep Builder, Tableau Online, Public Integration with R, and Big Data.
To unlock the Henry Harvin Tableau Course Completion Certificate, you must complete at least one session and pass the course test with a minimum score of 80% and required attendance as part of your Tableau Training. Moreover, you need to submit the projects and assignments.
Projects included in hands-on practical training are:
HR: Analyze the Attrition rate of Employees
Sales: Predicting Department wise Sales
Multi-Domain: Business Analytics Optimization
Marketing: Website Trend Analysis
Financial Analysis: Stock Market Prediction
Finance: Analyze ETF Trends
Henry Harvin’s Tableau Course Curriculum:
Data Visualization and Power of Tableau Overview
Architecture of Tableau
Working with Metadata and Data Blending
Creation of Sets
Working with Filters
Organizing Data and Visual Analytics
Working with Mapping Preview
Working with Calculations and Expressions
Working with Parameters Preview
Charts and Graphs
Dashboards and Stories
Tableau Prep
Tableau with R and Hadoop
Henry Harvin charges 12,700 plus GST with EMI starting at 1667 monthly. The course duration of Henry Harvin’s Tableau course is 32 hrs for online instructor-led training.
.png)
Hi, Do you want to take 10
Minutes Counselling worth 25$ for FREE?
Our Career Advisor will give you a call shortly


